Are there any comparative indexes for comparison of living standard or quality of life (QoL) and property price ratio to income?
A.
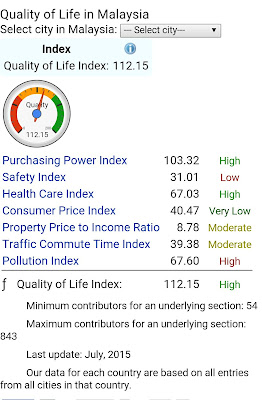
www.numbeo.com is an interesting portal for indices which can be used for city to city comparison. It provides figures on 'Cost of Living' and this includes some common economics indexes like CPI, Food Prices, Property Prices, Rental Value, Transportation Cost, etc.
The good thing is that different currency can be chosen for comparison. For my comparison below, I chose to use MYR Ringgit as the common currency for comparison.
Of course, any figure would be subject to bias. This method is gathering figures from public probably without much filter, and therefore, the data collected only reflects certain accuracy level likely to take as face value. Nevertheless, it is quite a good source of data if the contributors are in hundreds and thousands.
Some comparisons are inserted below for your reading.
The analysis above showed among others:
1. The property price to income ratio being accurately indicating the most expensive property in Hong Kong.
2. Pollution index is probably quite accurate too with some cities being norturiously polluted.
3. The criticism is likely the fact that some figure are relative to each other and not absolute. For example, property price to Income ratio is subjected to two parameters. One being the property price, and another being the income. Hence, the same property price with different income level would arrive at two different scenarios. For within Malaysia, there are cities will higher income like KL, and less income like Kuching.
Hence, if the income difference level is big, the property prices may differ a lot although the ratio is the same. Take for example, 100:10 vs 300:30, they are of the same ratio, but the property price is three times more!
Well, to make it look more realistic. Let's see 3,000,000:300,000 (KUL) and 1,000,000:100,000 (KCH). Most people can probably earn 100,000 a year. In KUL most likely 300,000 a year is also not alarmingly high. But 1 mio vs 3 mio property, that is a big gap! Imagine the 3 mio property in Kuching, that is astronomical!
picture below shows the various items taken in pricing survey as bases of comparison.
Ref:


No comments:
Post a Comment